In This Section
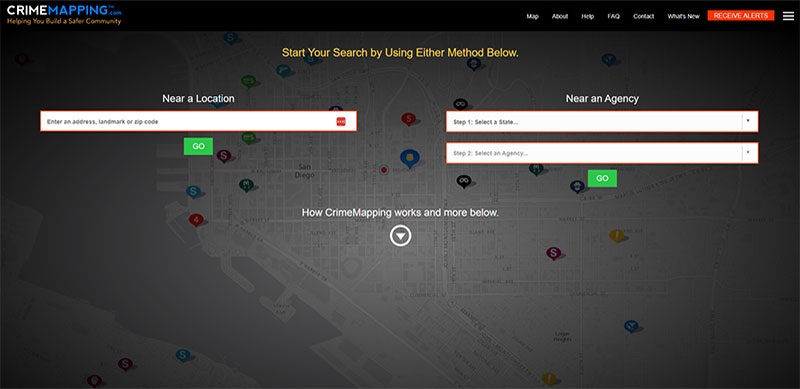
View CrimeMapping
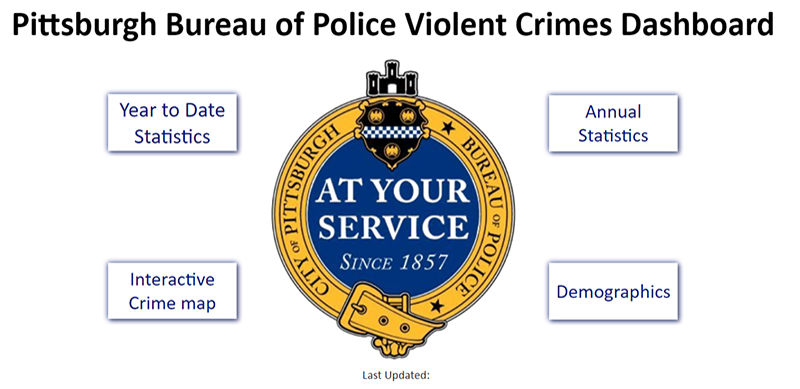
View Dashboard View Disclaimer(PDF, 171KB)
View Dashboard View Disclaimer(PDF, 221KB)
last updated: 06/16/2026